MATERHORN
Mountain Terrain Atmospheric Modeling and Observations Program.

Figure
1.: Granite Peak at sunset - seen from Ibapah Peak, Deep Creek
Mountains, UT.
The
Mountain Terrain
Atmospheric Modeling and Observations
Program (MATERHORN) is a
multidisciplinary University Research Initiative (MURI) sponsered
by the Office of Naval Research. Please check the official
web-page of the MATERHORN program at the University of Notre
Dame, with links to other research groups. This webpage is an overview
of work planned and conducted at the University of Utah by the Hoch
& Whiteman research groups as part of the MATERHORN-X team.
Introduction
MATERHORN
is a three-year meteorological research program to identify and
study the limitations of current state-of-the-science mesoscale
models for mountain terrain weather prediction and to develop
scientific tools to help gain advances in predictability. It
consists of four synergistic components: a modeling
component (MATERHORN-M), a technology component (MATERHORN-T), a
parameterization component (MATERHORN-P) and a field
experimental component (MATERHORN-X)
The core scientific objective of MATERHORN-X is to gain a fundamental understanding of the interaction of small and large-scale motions in the complex terrain of the Granite Mountain Atmospheric Science Testbed (GMAST) facility at Dugway Proving Ground (DPG), and to improve the predictability of complex terrain weather by gaining an improved understanding of model errors, error growth and predictability limits. The data collected in MATERHORN-X will facilitate model validation, data assimilation and development of physics-based parameterizations.
The core scientific objective of MATERHORN-X is to gain a fundamental understanding of the interaction of small and large-scale motions in the complex terrain of the Granite Mountain Atmospheric Science Testbed (GMAST) facility at Dugway Proving Ground (DPG), and to improve the predictability of complex terrain weather by gaining an improved understanding of model errors, error growth and predictability limits. The data collected in MATERHORN-X will facilitate model validation, data assimilation and development of physics-based parameterizations.
 Figure
2.: Schematic of the land-surface contrasts and flow
interactions around Granite Peak, UT.
|
The surroundings of
Granite Peak are characterized by the land surface contrasts
beween vegetated areas ("sparse sagebrush" - actually a
mixture of vegetation of greasewood, saltbush, rabbitbrush,
blackbrush, ephedra and sage brush) and the non-vegetated
playa located west of Granite Mountain. A playa is an
undrained flat basin floor between desert mountain ranges that
seasonally becomes temporarily covered with water. Because the
playa soil develops a salty white crust that is highly
reflective during dry periods and becomes moist during wet
periods, large energy budget contrasts occur between the playa
and its drier surroundings. These surface contrasts drive
"playa breezes" - circulations that are similar to the
better-known land-sea breeze circulations.
The study site at DPG is surrounded by higher topography to the northeast (Cedar Mountains), the Simpson Mountains, Keg Mountains and the Dugway Range to the south, and Granite Mountain to the west. This geographic setup leads to a characteristic diurnal pattern of thermally driven circulation during synoptically quiescent times, with north-westerly up-valley flow at daytime and a south-easterly down-valley flow during the night. Previous studies at DPG have shown the occurrence of up-and downslope flows along the eastern slopes of Granite Peak. The east slope of Granite Peak is on of the hot-spots for field observations during MATERHORN-X |
Activities
Surface Winds
The network of 10-m
meteorological towers "SAMS" operated by DPG reveals the typical
diurnal wind pattern that is dominated by thermally driven
circulations under synoptically quiescent conditions, as seen in
Figure 3.

Figure
3.: Animation of temperature and winds at each SAMS station
for days in September, October and November (SON) under
quiescent conditions. Quiescent conditions are defined by
NCEP/NCAR 700 mb wind speed of less than 5 m/s (10 kts). Days
are defined as 18 UTC -18 UTC, and both the 00 UTC and 12 UTC
times on that day must have 700mb winds less than 5 m/s to
qualify. This is fairly restrictive, with less than 10%
of days qualifying. N for each station varies due to
period-of-record differences. Source: Matt Jeglum, University
of Utah
|
Energy Balance Studies
All components of the
surface energy balance will be observed at three Extended Flux
Sites (EFS), EFS Playa, EFS Sagebrush, and EFS Slope.
At all three sites, observations of the four components of the surface radiation balance are observed with state-of-the-art radiation instrumentation. Net radiation is the sum of the four (incoming and outgoing / longwave and shortwave) components.
The turbulent fluxes, sensible (H) and latent (L) heat fluxes are measured using eddy-flux instrumentation by Eric Pardyjak's group in the University of Utah's Mechanical Engineering department.
Special care is taken to properly evaluate the subsurface heat flux, using self-calibrating heat flux plates and correcting for the energy storage change in the soil layers above the plates. Special probes are used to measure the thermal diffusivity and heat capacity of the soil.
The spatial variation of global
radiation in complex terrain is
generally considered the driving forcing
for temperature contrasts and the
formation of micro-climates in
mountainous terrain. We have developed a
simple computer code that calculates
global radiation as a function of the
solar position and the slope angles
derived from a digital elevation model.
Animations of global radiation for
Granite Peak and its surroundings can be
found here.
Slope
flows on the east slope of Granite Peak
were made using a line of 5 tall (≥20 m)
meteorological towers, ~20 weather
stations and several Doppler wind
LiDARs.
Arrays of fine-wire thermocouples are being used to
determine the temporal evolution of the detailed temperature structure
in the near-ground layer (lowest 3 m) at the three EFS sites.
Results & Presentations
At all three sites, observations of the four components of the surface radiation balance are observed with state-of-the-art radiation instrumentation. Net radiation is the sum of the four (incoming and outgoing / longwave and shortwave) components.
The turbulent fluxes, sensible (H) and latent (L) heat fluxes are measured using eddy-flux instrumentation by Eric Pardyjak's group in the University of Utah's Mechanical Engineering department.
Special care is taken to properly evaluate the subsurface heat flux, using self-calibrating heat flux plates and correcting for the energy storage change in the soil layers above the plates. Special probes are used to measure the thermal diffusivity and heat capacity of the soil.
 |
 |
Figure 4: Diurnal cycle of shortwave incoming and shortwave outgoing radiative fluxes observed at EFS Sage and EFS-Playa, 7 October 2012. |
Figure 5: Diurnal cycle of energy balance components observed at EFS Sage and EFS-Playa, 7 October 2012. |
Global Radiation in Complex Terrain
The spatial variation of global
radiation in complex terrain is
generally considered the driving forcing
for temperature contrasts and the
formation of micro-climates in
mountainous terrain. We have developed a
simple computer code that calculates
global radiation as a function of the
solar position and the slope angles
derived from a digital elevation model.
Animations of global radiation for
Granite Peak and its surroundings can be
found here.
Global Radiation in Complex Terrain
Global Radiation in Complex Terrain
Slope Flow Studies
Slope
flows on the east slope of Granite Peak
were made using a line of 5 tall (≥20 m)
meteorological towers, ~20 weather
stations and several Doppler wind
LiDARs.
Slope Flow Studies
Slope Flow Studies
Slope Flow Studies
Slope Flow Studies
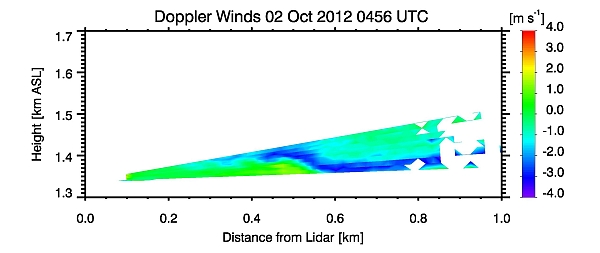 |
Visualization
of LiDAR scans on 2 Oct 2012 on the east slope of Granite Peak
(Fig. 6). Color contours give the wind speed along the LiDAR
beam - Blue colors indicate flow towards the LiDAR (i.e.
down-slope). While additional analysis is needed for this 2156 MST case, the LiDAR data depicts the interaction between a shallow downslope drainage flow and an apparent colder pool of air that is sloshing up the slope and undercutting the downslope flow layer. Patterns resembling Kelvin-Helmholtz waves can be seen at the top of the colder air layer. |
Figure 6: LiDAR scan 2 October 0456 UTC. |
Near-Surface Temperature Evolution
Arrays of fine-wire thermocouples are being used to
determine the temporal evolution of the detailed temperature structure
in the near-ground layer (lowest 3 m) at the three EFS sites.
Near-Surface Temperature Evolution
Near-Surface Temperature Evolution
Results & Presentations
last edits 31 Jan. 2013 - SWH