Apply thermodynamic principles to diagnose key parcel-based indicies widely used in the atmospheric sciences.
Part 1:
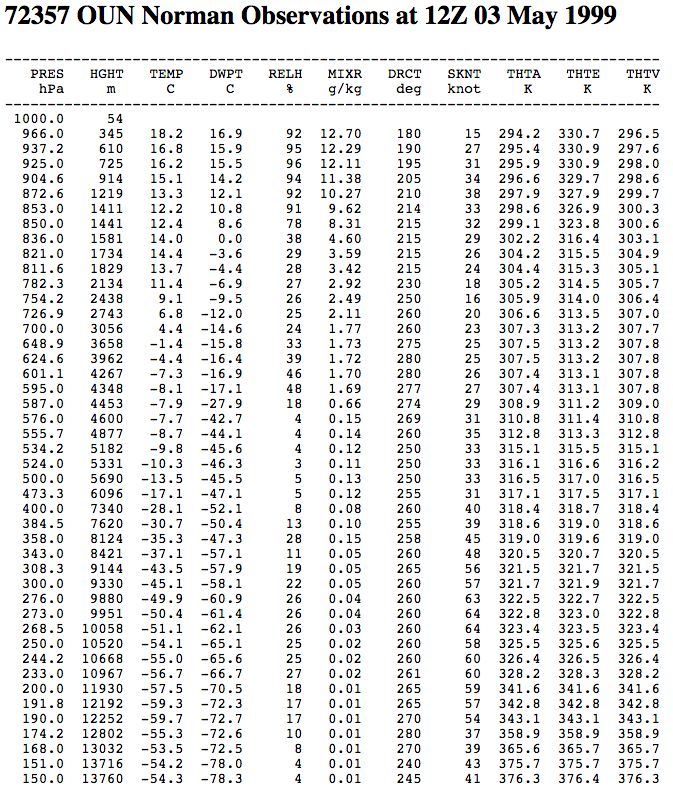
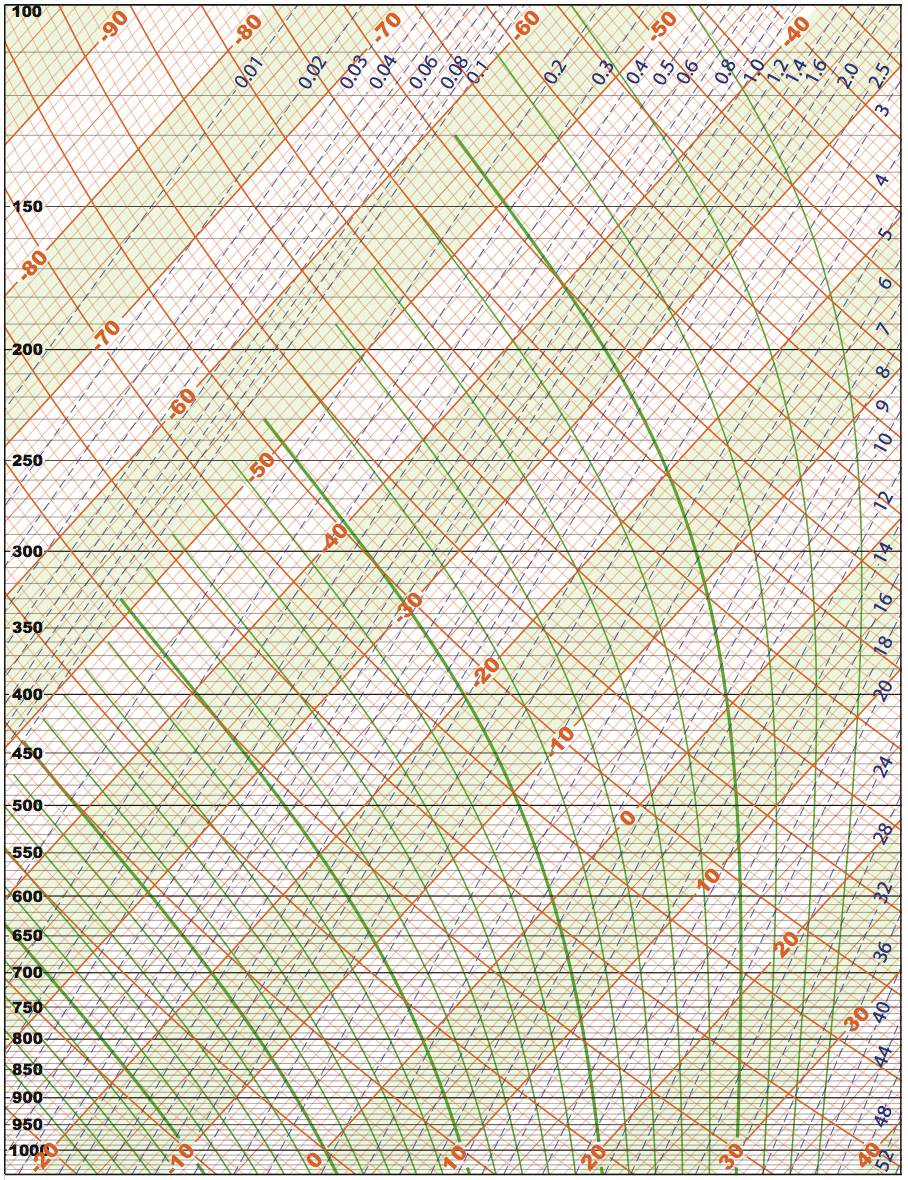
Print out the skew-T available here (source: Grant Petty, https://sundogpublishingstore.myshopify.com/) and plot the environmental temperature and dewpoint profiles based on the data provided below from Norman, Oklahoma at 1200 UTC 3 May, 1999. For ease, plot to nearest whole degree.
Part 2:
Using the skew-T diagnose the following for a surface parcel: (1) lifting condensation level, (2) convective condensation level, (3) convective temperature, (4) level of free convection, (5) equilibrium level, (6) level of maximum parcel buoyancy. Provide values for each of these and turn in your skew-T to show your work. Discuss any challenges encountered in diagnosing these values.
