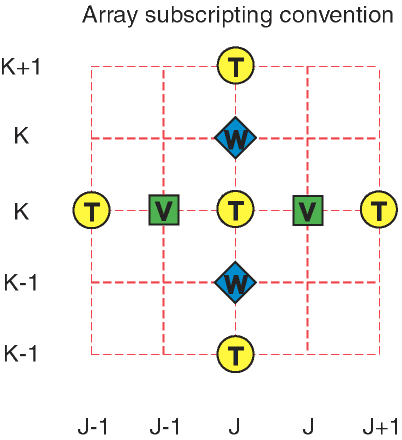
In this diagram, the horizontal (y) coordinate increases to the right, and the vertical (z) coordinate increases upward.
The diagram shows a section of the model grid that is 2 grid intervals wide and 2 grid intervals high.
This section is centered on a T-point (where the potential temperature and the perturbation pressure are located).
The 4 nearest T-points are also shown, along with the 2 nearest V-points (where the horizontal velocity is located) and the 2 nearest W-points (where the vertical velocity is located).
Also shown are the corresponding Fortran array subcripts for variables located at T-points, V-points, and W-points.
You should construct similar diagrams, one centered on a V-point and one on a W-point.