
The 2015-2016
Salt Lake Valley PM2.5 Pollution Study is a multi-university study
sponsored by the Utah Division of Air Quality. Researchers from the University
of Utah (UU), Weber State
University (WSU), Utah State
University (USU), and from the Utah
Division of Air Quality (DAQ) are combining their expertise and
observational tools to study chemical transformation in Salt Lake
Valley's persistent wintertime inversions. The goal of the study led by
lead PI Munkh Baasandorj is to investigate the reactive pathways of the
formation of secondary particulate pollutants and the coupling of
meteorological and chemical processes.
The passing
of high pressure ridges during wintertime favors the formation of
persistent wintertime cold air pools in Utah's topographic basins. Under
these conditions, the boundary layer is stably stratified and/or capped
by a capping inversion associated with warm air advection aloft. Under
these conditions, atmospheric mixing is limited and pollutants emitted
near the surface are accumulating, often exceeding the National Ambient
Air Quality Standard (NAAQS) for PM2.5. A typical winter in the Salt
Lake City Basin sees about 6 multi-day events comprising 18 days
(Whiteman et al. 2014) when the
NAAQS is exceeded.
My role is
to capture the meteorological conditions during the air pollution
episodes. Instrumentation ranging from small inexpensive temperature
dataloggers deployed along an elevation-transect from the valley floor
up the basin sidewall, to sophisticated remote-sensing equipment such as
ceilometers and a Doppler Wind LiDAR, are used to monitor the spatial
and temporal variation of the atmospheric conditions of the valley cold
pools.
Key components of the meteorological measurements include the timing and
strength of mixing in the early morning, when two reservoirs of air, the
surface layer and the upper part of the cold pool, are combined and
allow chemical reactions to take place.
The influence of other meteorological phenomena, such as the lake
breeze, clean air inflows from tributary valleys (Parleys Canyon, Mill
Creek, etc.), and top-down erosion of the basin cold air pools are also
investigated.
Quicklooks of
the collected meteorological data sets can be found at
http://www.inscc.utah.edu/~hoch/DAQSTUD/quicklooks/
An excellent background overview (click here) on the PM2.5 pollution problem in the Salt Lake City Basin has been compiled by Prof. C. David Whiteman. His webpage aims at answering the "frequently asked questions" on the topic and provides links to observations in the Salt Lake City Basin.
PM2.5
particulate pollution consists of suspended particles with a diameter of
or below 2.5 micrometers (for comparison, human hair has a diameter of
50-70 micrometers). A large fraction of the PM2.5 mass observed during
persistent wintertime inversions in the Salt Lake Basin is secondary
in origin. This means that the particulates are formed in the atmosphere
through chemical reactions of precursor gases. The main chemical
component of the wintertime PM2.5 in the Salt Lake Valley is ammonium
nitrate, which forms via reversible reactions of gas phase
ammonia and nitric acid. Hence a proper understanding of
the particulate pollution requires detailed information on the
particulate matter and its gas phase precursors.
On order to understand the
spatial and vertical variation of pollutants and precursors and the
influence of meteorological processes, in-situ and mobile observations
on the valley floor, along
the valley sidewall, and along vertical profiles are combined.
A map of the main
observation sites can be found here.
We thank all the volunteers and institutions that are hosting some of
our equipment in their back yards. The two main reference sites are
the DAQ Hawthorne Elementary site and the roof-top of a high building
on the University of Utah Campus. The elevation difference between
these two locations amounts to 155 m (~500 ft). Under the assumption
of horizontal homogeneity, two different levels within the cold air
pool are sampled.
Transects with the
University of Utah "Nerd
Mobile" (http://air.utah.edu/s/nerdmobile/) through the Salt
Lake City Basin reveal the spatial variation of pollutants. The Nerd
Mobile is operated by Ryan Bares of Prof.
John Lin's LAIR group during strong inversion events, and air
quality monitors on a UTA TRAX train are available via Prof. John
Horel's mesowest data interphase. See http://meso1.chpc.utah.edu/mesotrax/
for mobile TRAX measurements and http://meso2.chpc.utah.edu/gslso3s/cgi-bin/map.cgi
for a compilation by
Alex Jacques of
air quality observations throughout the Salt Lake basin.
Weber State University's
aerostat, a tethered balloon system, is being deployed by Prof.
John Sohl's HARBOR group to observe the vertical variation in
pollutant concentrations in the lowest 500 ft above ground.
Preliminary data and images of the aerostat operation can be found here.
| The
observation of the vertical variation of temperature, humidity
of pollutant concentrations in the atmosphere is difficult and
expensive. Measurements from a tethered balloon system are
subject to limitations of the FAA in the busy air space of the
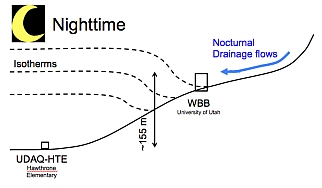
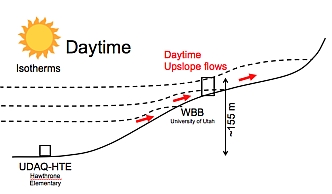
Salt Lake Valley and thus limited to the lowest 500 ft. The pseudo-vertical approach assumes horizontal homogeneity of the quantity being measured, and a pseudo-vertical profile of temperature or of a pollutant concentration is obtained by measurements along a topographic gradient. During our PM2.5 pollution study, detailed observations of pollutant concentrations and precursor gases are made at the valley floor (DAQ Hawthorne site) and on top of a tall building on the University of Utah campus, 155 m above the valley floor site. Concentration gradients can then be related to atmospheric stability (resistance to vertical mixing related to the temperature gradient), and the vertical variation of wind speed and wind direction in the basin. Thermally driven up-slope and down-slope flows may develop under clear-sky cold-pool conditions as illustrated in Fig 3 and may undermine the assumptions the pseudo-vertical approach is based on. Measurements of the wind and temperature structure along the basin sidewall are made to evaluate their potential impact. Figure
2: Illustrations of meteorological processes that could
undermine the assumption of horizontal homogeneity. During the
night (top panel), drainage flows from surrounding slopes
above the inversion top or from tributary valleys may impinge
on the cold air pool and advect cleaner air to the sidewall
observation sites. During daytime (bottom panel), up-slope
flows may transport pollutants up the valley sidewalls and
lead to observations of pollutant levels higher than those
that would be observed the same elevation within the center of
the basin.
|
 |
 |
The aerostat measurements,
although sporadic, will be highly useful to further evaluate the
pseudo-vertical assumptions.
A large fraction of the PM2.5 pollutants observed during persistent wintertime inversions in the Salt Lake Basin are secondary particulates, which means that they have formed within the atmosphere through chemical reactions from precursor gases. Our trace gas measurements are focused on two main precursors for the PM formation, gas-phase ammonia (NH3) and nitric acid (HNO3). Key questions we seek to address are (1) what the relative levels of the total nitrate and ammonium are, (2) what mechanism dominates the nitric acid formation, (3) what contributes to ammonia, and (4) which precursor plays the most important role in particulate formation. This information is essential for formulating effective control strategies.
Nitric Acid Formation We are measuring a wide suite of trace gases that play important role in atmospheric chemistry and in nitric acid formation including CO, NOx (NO and NO2), O3, NO3, and N2O5. Latter two species are the main atmospheric nighttime radicals, whose hydrolysis lead to the formation of nitric acid. We are conducting in-situ measurements of NO3 and N2O5 in the Salt Lake Basin using cavity ring-down spectroscopy technique in collaboration with Dr. Steven Brown, scientist from NOAA (http://www.esrl.noaa.gov/csd/staff/steven.s.brown/).
Gas-phase ammonia (NH3)
One of
these key components in the formation of the secondary particulate,
ammonia nitrate, is gas-phase ammonia (NH3); however little
is currently known about the availability of ammonia in the Salt Lake
Basin airshed. Prof.
Randy Martin from Utah State University is leading the effort to
measure the concentration and spatial distribution of NH3 along the
Wasatch Front, as well as in Cache Valley for comparison.
We are not only monitoring
the particulate mass concentration in real time using a tapered
element oscillating microbalance (TEOM; at DAQ Hawthorne and UU
rooftop site) but also investigating the chemical composition and size
distribution of particulates. Prof.
Kerry Kelly (UU) and Prof.
Randy Martin (USU) are combining their observational resources
to investigate the size distribution and chemical composition of the
particulate pollution. Their instrumentation can differentiate ultra
fine particulates with diameters between 0.015 to 0.7 micrometers and
fine to coarse particles from 0.5 to 20 micrometers. The evolution of
the particle size distribution throughout an inversion event can give
insight into possible sources and formation mechanisms. More
traditional PM2.5 filter-based sample are also being collected for
speciated chemical analysis to further delineate likely particle
sources. Additionally, ultra fine particles are particularly
interesting because they have a high surface area, and a number of
studies point to the importance of surface area on health outcomes.
Supported by other sources
of funding, Prof. John
Lin is working with Prof.
Jim Ehleringer and Prof.
Dave Bowling to carry out measurements of greenhouse gases at a
network of sites around Utah. Greenhouse gases such as carbon dioxide
(CO2) are often co-emitted with precursor gases that form
PM2.5 but are chemically inert in the atmosphere, thereby serving as
an useful passive tracer. The greenhouse gas observations are
displayed online in real-time at: air.utah.edu.
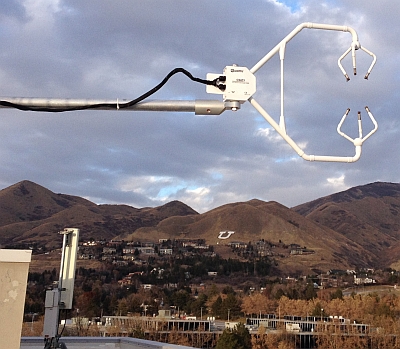
A wide variety of meteorological observations are available in the Salt Lake City Basin. These are, however, mostly limited to the basin floor. To investigate the formation, evolution and destruction of the persistent cold air pools, information about the vertical structure of the atmosphere (temperature stratification, wind profile) are needed. Besides the twice-daily radiosonde ascents conducted by the National Weather Service at the Salt Lake City Airport, pseudo-vertical temperature soundings are compiled from temperature observations with inexpensive automatic temperature data-loggers deployed in a transect up the valley sidewall. The wind profile within the basin is measured using a Doppler wind LiDAR (Fig. 6).
|
The upper panel of Fig. 3 shows the time series of potential temperatures at the valley floor (~1300 m MSL) and at the mean top height of the Salt Lake City Basin, ~2200 m MSL, derived from the radiosonde observations by the National Weather Service from the Salt Lake City Airport. The difference between the two curves indicates how stable the valley atmosphere is stratified. When the two curves touch, the atmosphere is referred to as neutral for dry adiabatic processes and there is no resistance to vertical mixing. The further the two curves deviate, the higher is the stability and the harder it is to mix pollutants emitted at the surface. The bottom panel of Fig. 3 shows the Valley Heat Deficit a measurement of the energy that would be needed to bring the atmosphere to a neutral stratification. A correlation between the Valley Heat Deficit and PM2.5 pollution (red curve) becomes evident, as previously reported by Whiteman et al. (2014). Fig. 3 further
illustrated that the strong wintertime inversions are often
caused by warm air advection aloft rather than through enhance
cooling near the surface. |
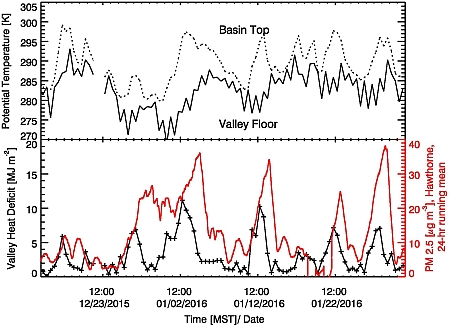 |
Figure
3: Potential temperature at the base and top of the Salt Lake
City Basin from radiosonde observations by the National
Weather Service (top), and the Valley Heat Deficit and the
smoothed observations of PM2.5 pollutant concentrations from
the DAQ Hawthorne site.
|
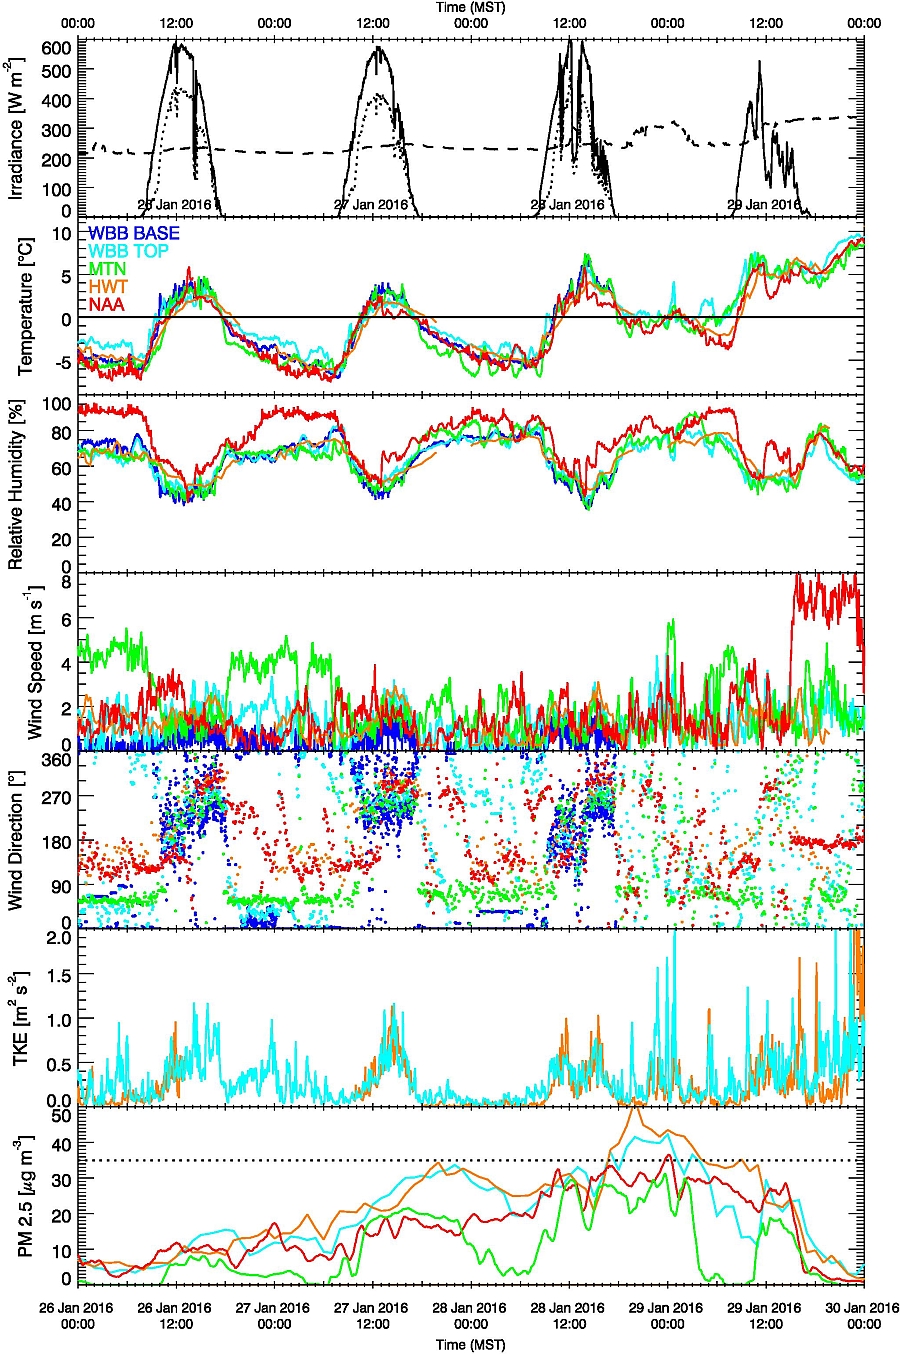
Figure 4 shows selected time series of meteorological variables and PM2.5 concentrations observed during the 26-30 January pollution episode. The atmosphere in the Salt Lake Basin has been stably stratified, limiting vertical mixing. Typically, and under dry conditions, the temperature decreases with height by 9.8°C/km. Under "Inversion" conditions this temperature structure is inverted, which means that the temperature increases with height. Indications for this inversion can be seen in the 2nd panel of Fig. 4.; the temperature measured at NAA, for example, is lower then that measured at the University of Utah campus (blue).
The influence of nocturnal
down-valley flows on the local air quality is nicely illustrated in
Fig. 4. A down-valley flow established during the nights at the mouth
of Red Butte Canyon (MTN site, green curves), indicated by a steady
easterly flow direction. This flow tends to bring cleaner air into the
Salt Lake City Basin, and a reduction in PM2.5 pollutant
concentrations are observed (green curve, bottom panel).
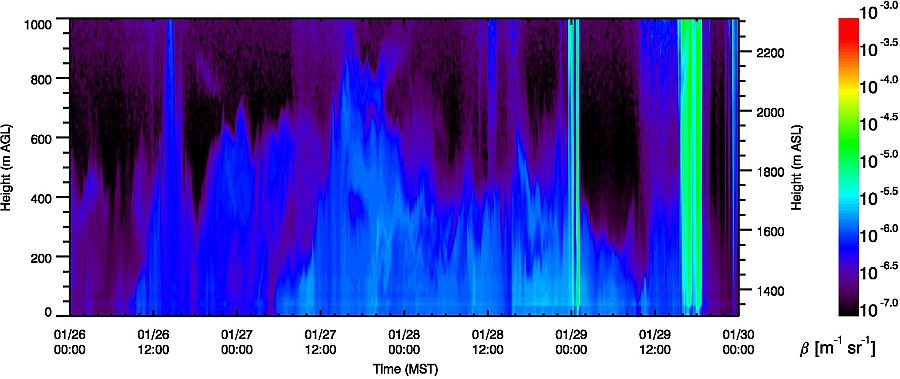
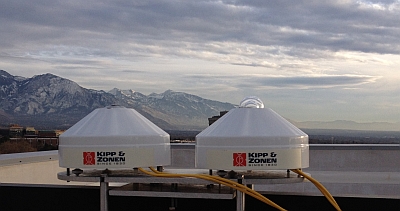
Laser
ceilometers, deployed at Hawthorne Elementary, the University of Utah
campus, and at the mouth of Red Butte Canyon, emit laser signals that
are scattered back to the instruments by natural
aerosols, hydrometeors (cloud droplets, rain, etc.), and anthropogenic
aerosols such as particulate pollutants (PM10, PM2.5). By combining the
backscatter signals, in-situ observations of PM2.5 concentrations, and
LiDAR retrievals of the vertical wind profile, we are investigating the
atmospheric mixing processes that influence the vertical and horizontal
distribution of particulate pollution. Fig. 3 shows a time-height cross
section of atmospheric backscatter coefficient measured at Hawthorne
Elementary during the 26-30 January 2016 pollution episode. The layered
structure and a large day-to-day variation in the height of the aerosol
layer becomes apparent. Precipitation events are indicated by elevated
backscatter values (29 Jan. 0100 MST, 1600-1900 MST).
 |
  |
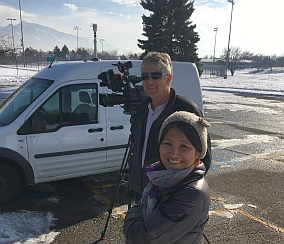  |
We received some press
coverage:
Another pollution episode followed the episode illustrated above. A persistent cold air pool developed in early-mid February 2016 and led to an exceedance of the NAAQS on 8 consecutive days. This episode continues to be studied and several publications covering this episode are expected to appear in the scientific literature.
last edited - 09/26/2016
sebastian.hoch * utah.edu