Physics based economic forecasting and hindcasting
© TIM Garrett 2014
This work is licensed under a Creative Commons Attribution-NonCommercial 4.0 International License.
THIS PAGE IS BASED ON AN ARTICLE IN THE COPERNICUS JOURNAL EARTH SYSTEM DYNAMICS
Long run evolution of the global economy: 2. Hindcasts of Innovation and Growth

One of the more challenging problems in physics is the evolution of complex systems. Atmospheric scientists study phenomena ranging in scale from those of molecules to the size of the planet, and struggle with integrating the full gamut of interacting forces into a usefully comprehensive whole.
The world’s economy could easily be another example where individual actions become intertwined with global trade agreements. These economic forces may seem uniquely human, but it must be acknowledged that they are also part of the physical universe. Many of us would like to know where the economy is headed so perhaps the many well-established tools from physics could be used for addressing such problems. These forecasting tools aredeveloped most fully in the geosciences where predictions are a major component of forecasting earthquakes, wind, and tides. Can we apply these tools to determine our financial future?

For illustration, consider this beautiful woodcut. We might ask ourselves which way is the boat going? Up or down? The artist Hokusai conveys the sense that the oarsmen in the foreground are moving upward towards the crest of a wave. But really, we cannot know because all we see is a snapshot in time.
The first thing we might wish to ask the artist is where the boat was a few moments earlier. Then, assuming the boat has inertia, we might sensibly suppose that the boat continues its current upward or downward trend. As a means for making a forecast of the boat’s position, we might call this technique “Persistence in Trends”. We might feel confident that such a forecast does better than assuming a model of mere “Persistence” that does not have the boat not move at all.
Going further, we would probably want to have a model for the physics of an ocean wave. We all have some intuitive sense that waves go up and down with a period and an amplitude, and that really big waves can break. With a background in ocean physics we might even be able to go further to make some fairly accurate predictions. Important things to know would be the amount of existing energy in the wave, the rate at which energy is being supplied to the wave, and the nature of the forces that pull the wave down.
Economic hindcasts and Skill Scores
With an understanding of the physical forces governing the economy we can to do something similar. Being able to predict how economic systems respond to external forces offers the possibility of making robust, physically constrained economic forecasts. A way to test any prognostic model framework is to perform what in meteorological forecasting is called “hindcasts”: How well can a deterministic model predict present conditions initialized with the conditions observed at some point in the past?
Model accuracy is evaluated using a “Skill Score”, which expresses how well the model hindcast reproduces current conditions relative to some Reference Model that requires zero skill. In the Hokusai woodblock, a zero skill Reference Model of “Persistence” would assume the boat stays still; “Persistence in Trends” would assume the boat continues on its existing trajectory. A model based on ocean physics would hopefully beat either of these simple models to exhibit “positive skill”. The Skill Score would be
Skill Score = [1 - (Error of the hindcast)/(Error of the Reference model)]x100%
If a physics-based model does no better than the reference at predicting the present, then the Skill Score is zero percent. If it does perfectly, then the Skill Score is 100%.
Hindcasts of civilization growth
I have applied these techniques to evaluate a new economic growth model for the long-run evolution of civilization. The model approaches the global economy rather like an organism, where civilization's growth rate is determined by its past well-being, environmental predation, whether it eats all its food, and whether it is able to move on to discover new food sources. For civilization, food is things like oil and iron. These are things we deplete but can also use to discover new reservoirs, if they exist. Our ability to discover these reservoirs might easily be impeded by natural disasters, such as those we might experience from CO2 induced climate change. The model provides deterministic expressions for civilization’s rates of economic growth and energy consumption that are rooted in what is some fairly straight-forward physics (though admittedly it took a few years to sort it all out).
Input parameters to the model are the current rate of growth of global energy consumption and wealth η (what is termed the “rate of return”), and a rate of technological change that can be derived from, among other things, past observations of inflation and raw material consumption. Output parameters include the rate of return on wealth and primary energy consumption, how fast this rate is growing (or what is termed the “innovation rate”), and the world GDP growth rate (or GWP).
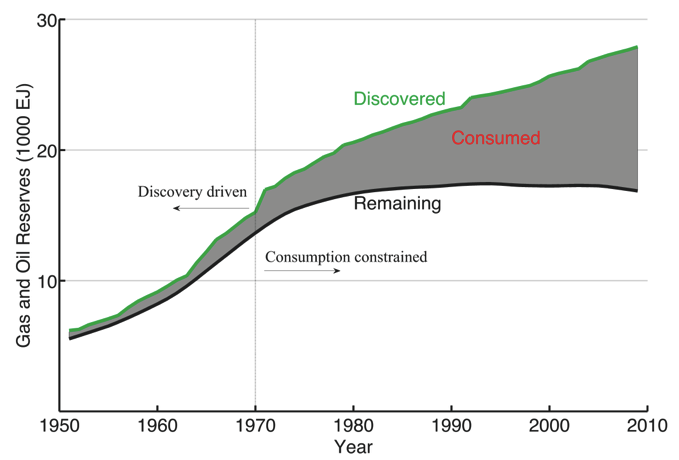
No other economic model I am aware of is capable of such accuracy, at least not without cheating by tuning the model to data between 1960 and 2010. How is it then that the physics-based model does so well at predicting the present based only on conditions 50 years ago? Well, the obvious answer might be that humanity acts as a physical system and the model at least has the correct physics. But it helps too that the model was initialized in the mid-twentieth century when civilization was responding to an exceptionally strong impulse of fossil fuel discovery. The figure above shows that between 1950 and 1970, remaining reserves of oil and natural gas doubled because discoveries outpaced depletion. Since, discovery and depletion have been in approximate balance; remaining reserves have been more or less stable.
It was as if civilization suddenly found itself at a restaurant buffet in 1950. Each time it visited the table it discovered new plates of delicious energy to consume, and its appetite increased apace. At some point around 1970, however, its appetite increased to the point that it discovered new food not much faster than it consumed the food that was already there. The amount of known food on the table stayed stable.
New discoveries matter, just not as much as showing up at the buffet in the first place. Finding the buffet was far more innovative than merely going back to the table, and it had a correspondingly large and lasting impact on economic growth.
That there was a remarkable discovery event between 1950 to 1970 period makes numerical modeling more straight-forward. What followed was a clear physical response to a strong prior forcing. I think this is why the hindcasts described here have such high Skill Scores.
Forecasting the future should be possible, but it will probably be more of a challenge than hindcasting the past 50 years...unless, once again there is a new wave of massive energy reserve discovery. Discovery would have to outpace growing demand if it is to propel civilization to a renewed phase of accelerated innovation and growth that is easily forecast using deterministic equations based on physics.
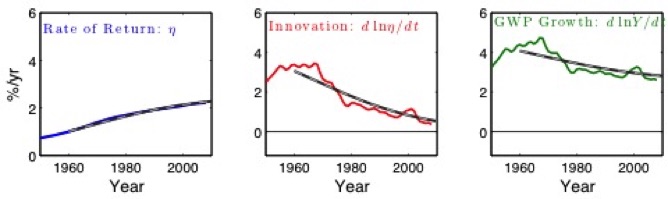
Gray lines: Fully prognostic model hindcasts initialized in 1960 for the global rate of return on wealth, economic innovation rates, and the GWP growth rate. Hindcasts are derived assuming an average rate of technological change of 5.1%/yr (dashed lines) derived from conditions observed in the 1950s. Solid colored lines: Observed decadal running means. The model reproduces observations with skill scores > 90%.
As shown in the figure above, a first principles physics-based model initialized in 1960, based only on observations available in the 1950s, does remarkably well at hindcasting evolution through the present. For example, average rates of energy consumption growth in the past decade would have been forecast to be 2.3 % per year relative to an observed average of 2.4 % per year. Relative to a persistence prediction of the 1.0% per year growth rate observed in the 1950s, the Skill Score is 96%.
Or, using the same model, a forecast of the GWP growth rate for 2000 to 2010 based on data from 1950 to 1960 would have been 2.8% per year compared to the actual observed rate of 2.6% per year. The persistence forecast based on the 1950 to 1960 period is 4.0% per year, so the skill score is 91%.
Economics About Physics of the economy What is wealth?
Energy, Innovation and growth Economic inertia Economic Forecasting Jevons' Paradox
Physics vs Mainsteam Economics Is Macroeconomics a Science? The economic heat engine
Economics and Climate GDP is not Wealth Are renewables the answer?
Is population growth a problem? Will growth transition to collapse?
What is your carbon footprint? Media Publications Presentations FAQ Criticisms